GIS that makes the overlooked undeniable.
Real maps, real data, real people who needed someone to notice. New ones posted here roughly every week.
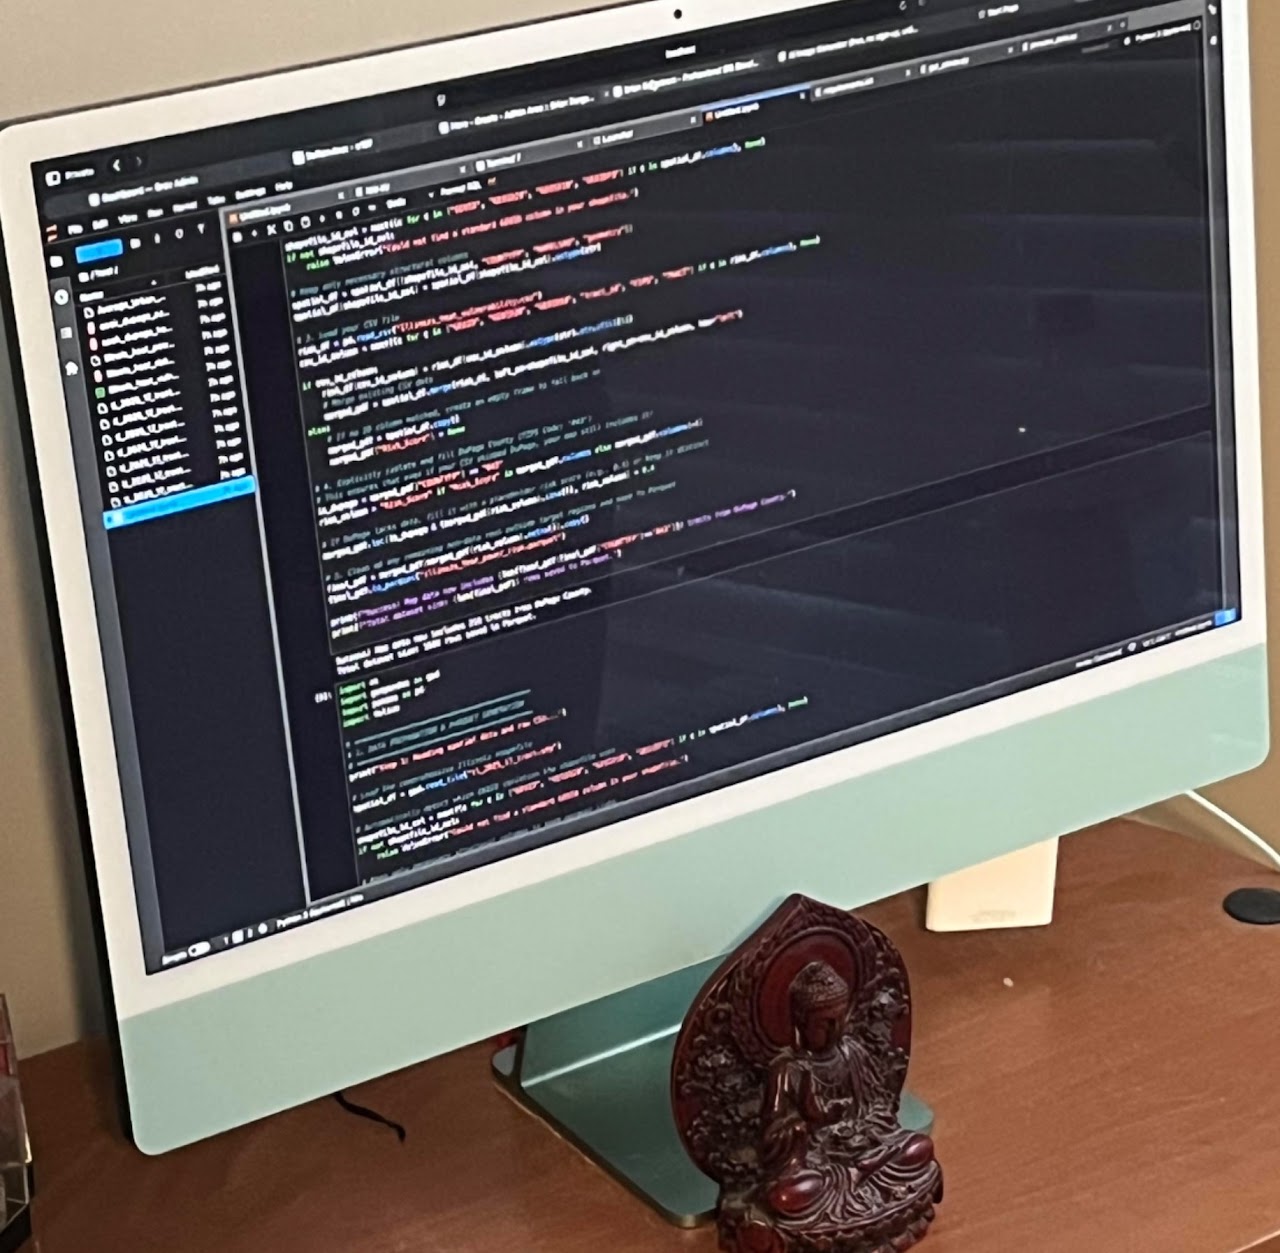
No headshot here — just my actual desk. I'd rather you see the work than my face.
About
I'm a GIS Analyst based in the Chicago area. I got here by a longer road than most people in this field — thirteen years of retail, a self-taught detour through IT, and a master's degree I found through a friend's recommendation. I don't drive, which turns out to matter more to how I work than almost anything else on my resume.
How I got here
-
2001 – 2014
Cashier and service clerk at Jewel-Osco, thirteen years. It taught me more about time management, staying calm under pressure, and handling money carefully than any class did. I don't try to force a straight line from this job to GIS — there isn't one. It's just where I spent my twenties and early thirties.
-
2018
BS in Information Technology, AIU Online.
-
2020 – 2023
Enrolled in the GIS master's program at Elmhurst University on a friend's recommendation, partly because it was advertised as "no coding required." I ended up writing Python and Arcade expressions in almost every project I built.
-
2023
Program Data Coordinator at NAMI DuPage, and — concurrently — their GIS Intern. Secured an Esri nonprofit grant that saved the organization thousands of dollars in licensing, and built the StoryMap that's still the piece of that work I'm proudest of. Left at the end of the year to finish my degree.
-
December 2023
MS in Geographic Information Systems, Elmhurst University.
-
2023 – 2026
Self-directed study, described in full below — no formal employer, but the busiest, most productive stretch of GIS work I've done.
-
August 2026 – present
Started volunteering with the Humanitarian OpenStreetMap Team (HOT) through GISCorps, described in full below. It's now where most of my GIS work happens.
What actually drives this work
I come from a very underserved mental health community — people who don't typically drive or own up-to-date technology, who are assumed to have access to things they don't actually have.
"I come from a very underserved mental health community. My projects are for them, even if they will never understand what I am doing 'with computers.'"
I don't think there's one tidy through-line connecting retail, IT, and GIS — when I've been asked directly, my honest answer has been that there isn't. What is real and specific is this: the mental-health-and-access work comes directly from where I live and who I live near, every day, not from a résumé narrative built backward to sound good.
Independent study, 2023 – present
After finishing my degree, I kept going — self-directed study of open-source GIS and Python tools (geemap, leafmap, OSMnx, DuckDB) under practitioners like Qiusheng Wu and Milan Janosov. I keep learning "regardless if it does not find me a job... it is the learning I enjoy doing." That stretch produced a cluster of live web apps and open-source tools, all built in the same intense burst in June 2026.
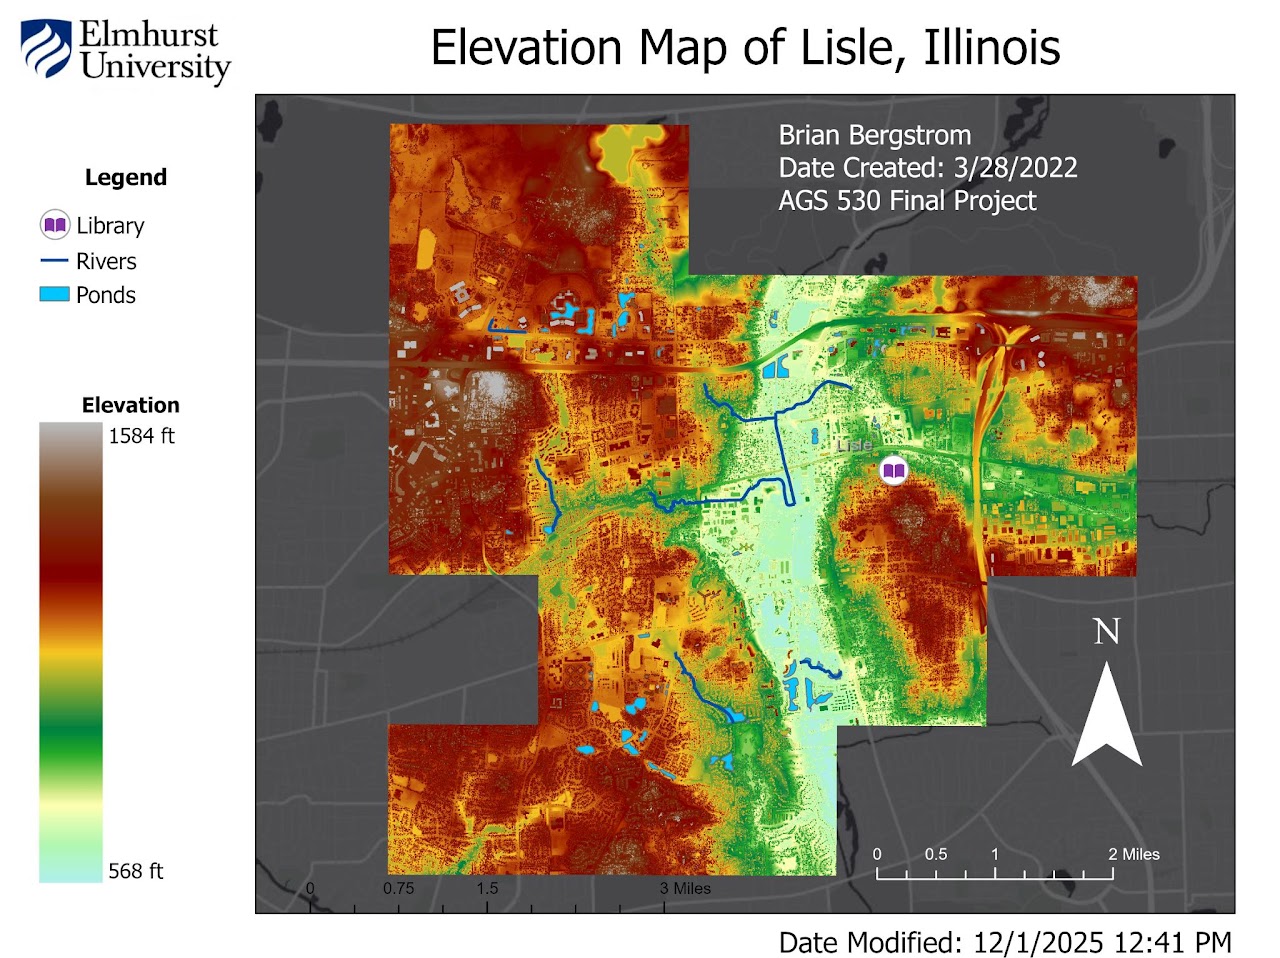
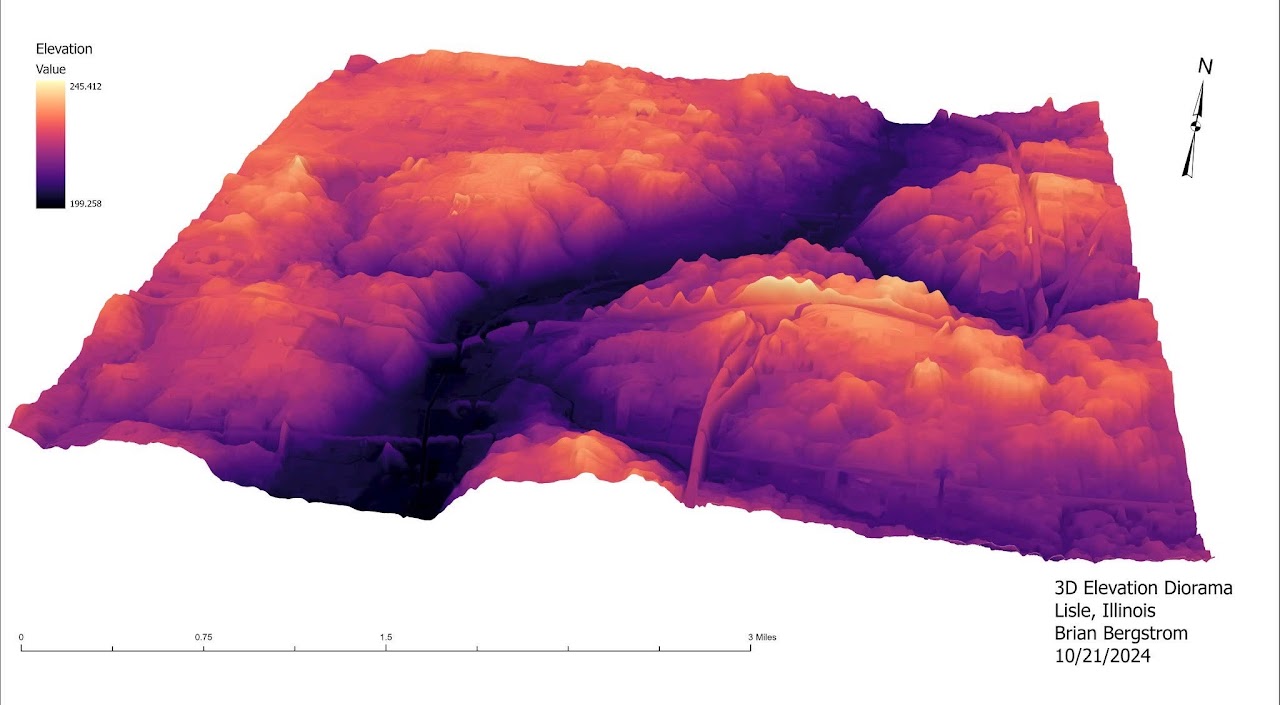
There's a third piece in that same series — an animated historical timelapse of Lisle starting from 1986, made in late 2025. View the timelapse (opens an animated image in a new tab)
Volunteering with the Humanitarian OpenStreetMap Team
I map for the Humanitarian OpenStreetMap Team (HOT) through GISCorps — tracing buildings and roads onto OpenStreetMap so responders and aid organizations have an actual base map to work from in places that don't have one. The Rasuwa flood response in this portfolio came directly out of that work.
It's grown past mapping into contributing to HOT's own open-source software — raw-data-api, tasking-manager, drone-tm, fAIr — fixing geometry and coordinate-reference-system bugs I kept running into as a mapper: invalid polygon exports, a GDAL axis-order error, a task grid that silently dropped tiles at a project's edge. I'm upfront with maintainers about using AI to help write and review the code, following HOT's own published guidance on it, and every pull request gets verified against the project's real test suite before I open it.
This is where most of my working hours actually go right now, and it's been the most rewarding stretch of GIS work I've done. See the pull requests on GitHub (opens in a new tab)
How I actually work
- I'm a practicing Buddhist and attend a weekly Zoom Dharma discussion group. It's helped me stay stable on my medication and my mental health over the past year, and it trains my mind for sitting with hard problems instead of rushing past them — that's the tone I've tried to carry into this whole site.
- I lean on AI for a lot of the common questions and debugging that used to eat my time, especially in Python libraries like folium and DuckDB. It's part of how I actually build now, not a secret.
- Outside of GIS, I read non-mainstream fantasy fiction — authors like Scott Lynch and Peter S. Beagle — and spend most of my leisure time watching Twitch, when I'm not playing JRPGs and puzzle games.