GIS that makes the overlooked undeniable.
Real maps, real data, real people who needed someone to notice. New ones posted here roughly every week.
57 Square Miles of Asphalt
Mapping every surface parking lot in the six-county Chicago region from aerial photos, and how much of it sits where Chicago and Illinois just ended parking minimums.
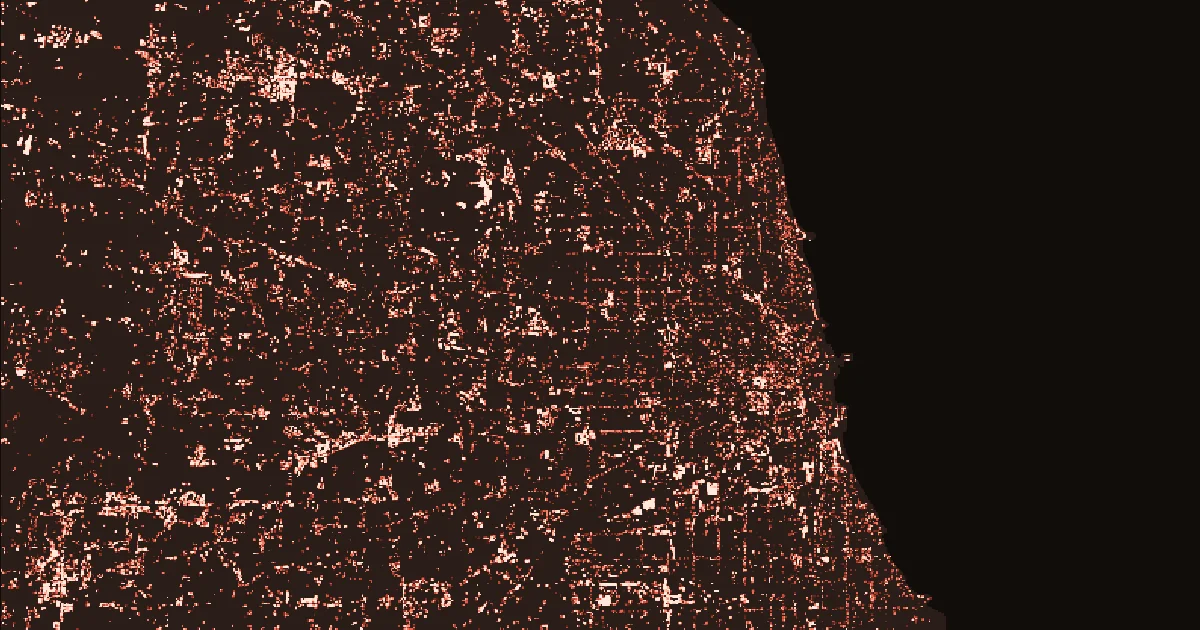
Parking minimums are gone. How much parking is there?
For decades, almost every town in the Chicago area required new buildings to come with parking: so many spaces per apartment, per square foot of store, per restaurant seat. That's a big part of why the region looks the way it does.
That's starting to change. On July 16, 2025, Chicago stopped requiring parking for new development near CTA and Metra stations and along its busiest bus lines. On June 1, 2026, the state went further. The Illinois People Over Parking Act bans parking minimums near rail stations and frequent bus routes in every municipality in the state, home rule or not.
Neither law removes a single parking space. Developers can still build as much parking as they want, and existing lots stay put. What the laws change is who decides. So it's worth knowing what we're starting from: how much of the region is already parking lot, and how much of that sits where the rules just changed?
Inside Chicago, there's a good answer already. In 2025, Shirin Qiam and Lewis Lehe at the University of Illinois used a similar machine-learning approach to map surface parking in 15 US cities, Chicago included, and published their data. The Parking Reform Network's Parking Lot Map measures downtowns from OpenStreetMap. But the laws now reach well past the city limits, and I couldn't find anything that covers every lot in the six-county region. So I made one.
The short answer
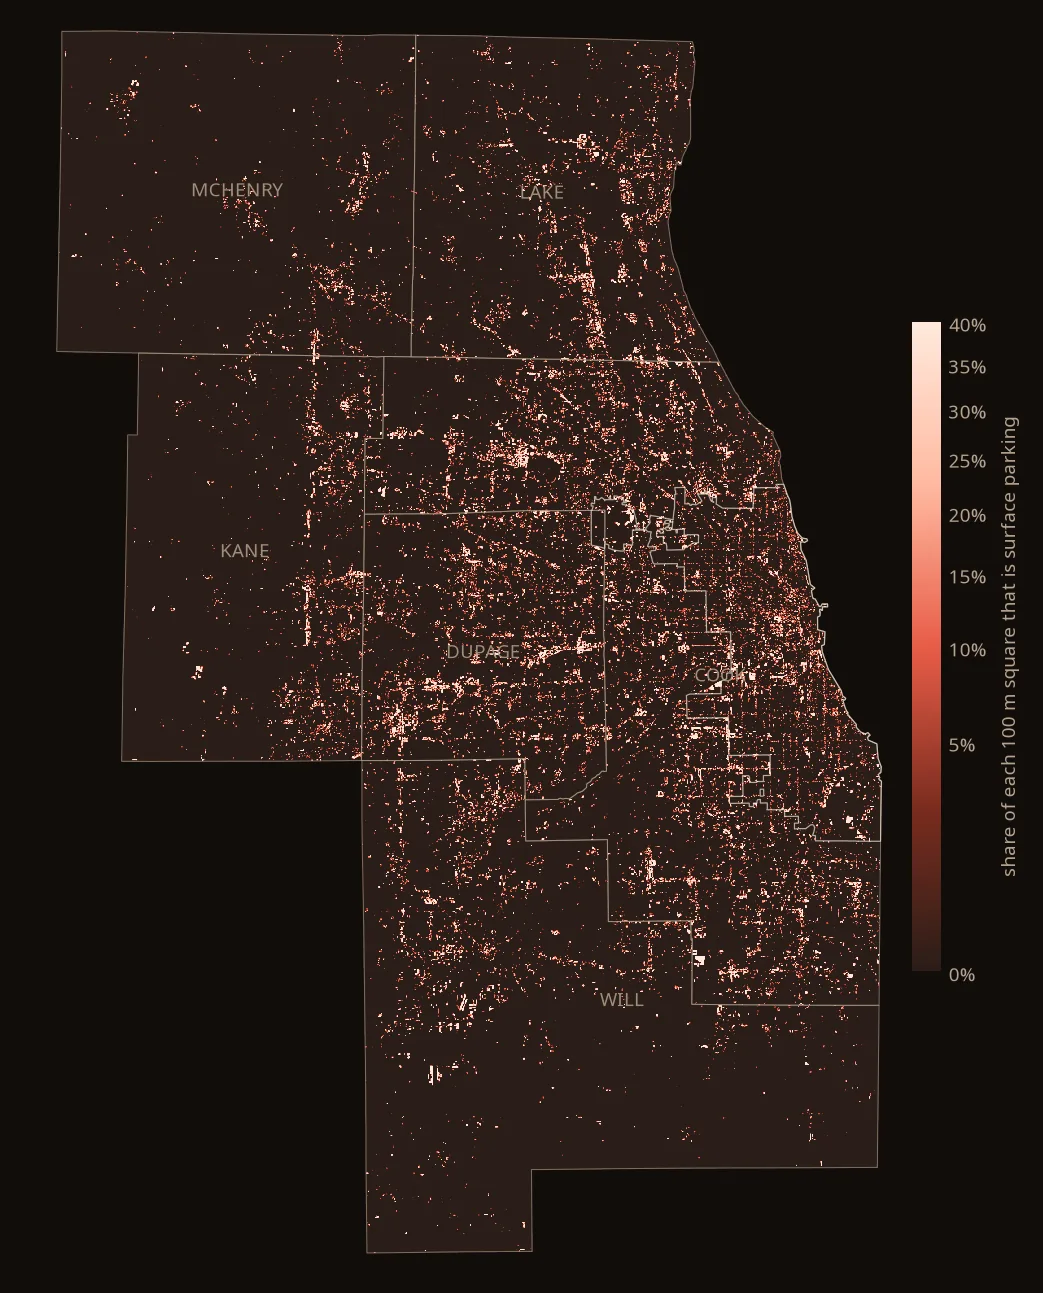
In 2023, at least 148 km² of the six-county region was surface parking. That's 57 square miles, or roughly 36,500 acres. It works out to 1.5% of all the land in Cook, DuPage, Kane, Lake, McHenry and Will counties, farms and forest preserves included. It's an area about a quarter the size of the City of Chicago.
That's a floor, and probably a low one. Inside Chicago, where I could check against a second, independent map, the real figure looks about one and a half times what my model found. If the suburbs are similar, the region's true total is more like 200 to 250 km² (80 to 100 square miles). I'd treat that range as a rough guide, not a measurement.
A few more numbers from the analysis:
- Cook County is 2.9% parking and DuPage 2.6%. The outer counties are much lower because so much of them is still farmland: Lake 1.4%, Kane 0.9%, Will 0.8%, McHenry 0.4%.
- Chicago is at least 3.3% parking, about 19.7 km² (4,870 acres) by my model. Checked against a second map, it's closer to 5%.
- OpenStreetMap, the biggest free map of the world, is missing at least half of it.
- About a quarter of the region's surface parking (24%) sits where the new state law applies, even though that area is less than a tenth of the region's land.
How I measured it
The raw material is NAIP, the National Agriculture Imagery Program: aerial photos the USDA flies over every state every few years. The 2023 Illinois flight is sharp enough to see individual parking stripes. I read it at 60 cm per pixel, with four bands (red, green, blue and near-infrared). For the six counties, that's 309 images and about 95 GB.
Nobody is going to trace 57 square miles of parking lots by hand, so I trained a computer to do it. The model is a U-Net, a kind of neural network built for exactly this job: look at an image and label every pixel, here "parking" or "not parking."
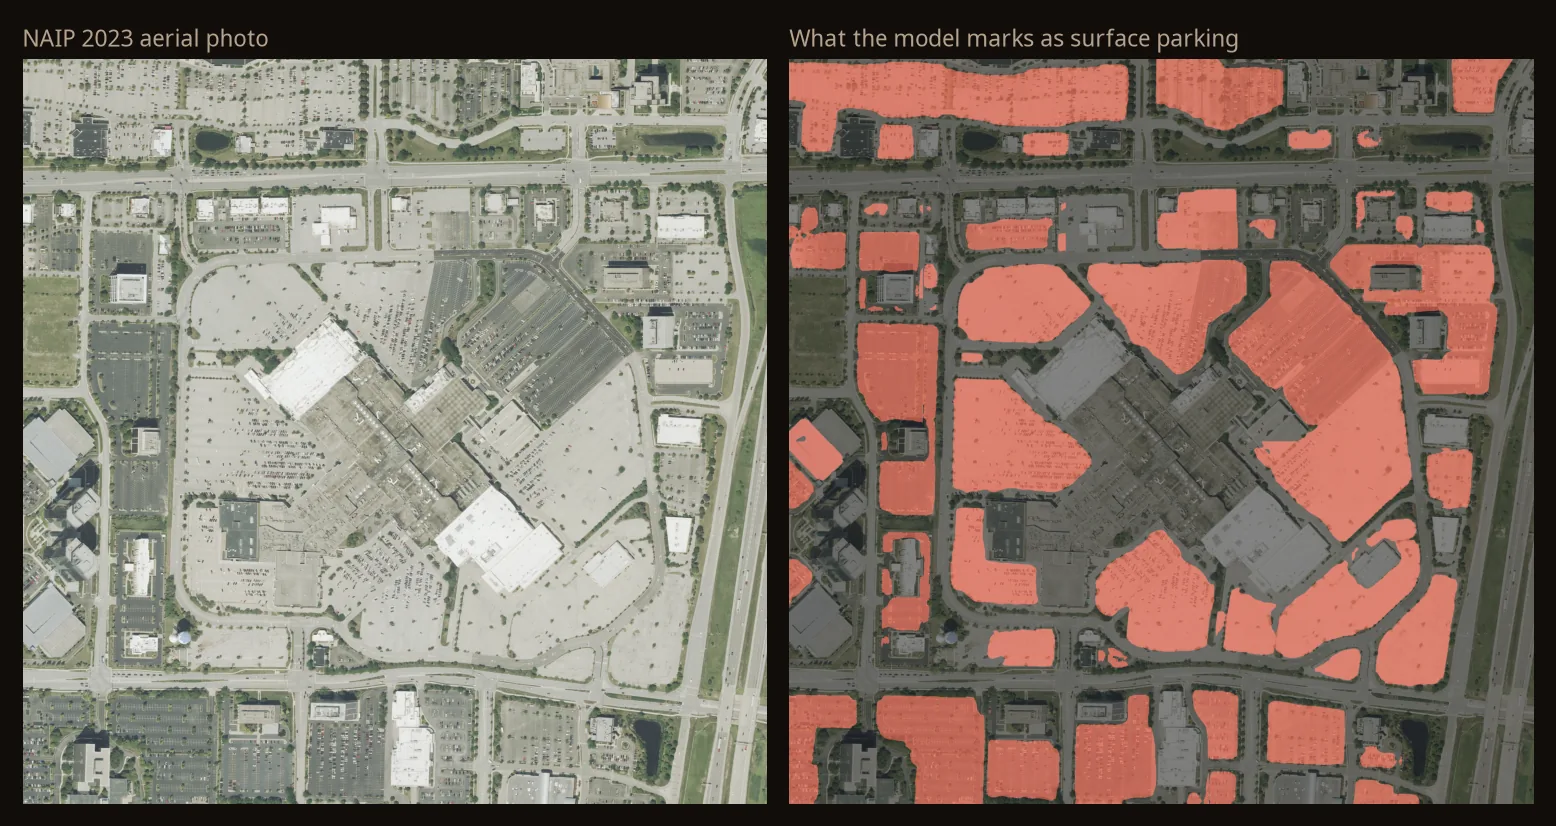
To learn what a parking lot looks like, a model needs examples. I used parking lots that volunteers have already drawn in OpenStreetMap (OSM). OSM's parking coverage is patchy, so I trained only on the places where it looked careful: tiles where mappers had drawn the aisles inside the lots, which is a sign somebody took their time. I also added tiles of plain fields and woods so the model would learn what "definitely nothing here" looks like. That came to about 7,000 training tiles, each 300 m on a side.
The training ran on my gaming laptop's GPU, an RTX 2060. Once trained, the model labeled the whole region in 53 minutes.
Then I checked its work by eye, twice:
- 48 random tiles held back from training. I graded each one against the photo. The model got 42 right. On the rest, it more often missed real parking than invented fake parking. So every total in this post should be read as a floor.
- 24 random spots where the model found parking that OSM doesn't have. More on this below.
- 24 random spots where my map and a second, independent map of Chicago disagree. That one told me how big the floor problem is. It's the next section.
Checking against a second map
UIUC's map of Chicago gave me something rare: a second, independent answer to the same question. Their model used different imagery (Google satellite tiles), different training data and a different network, so comparing the two is a real test.
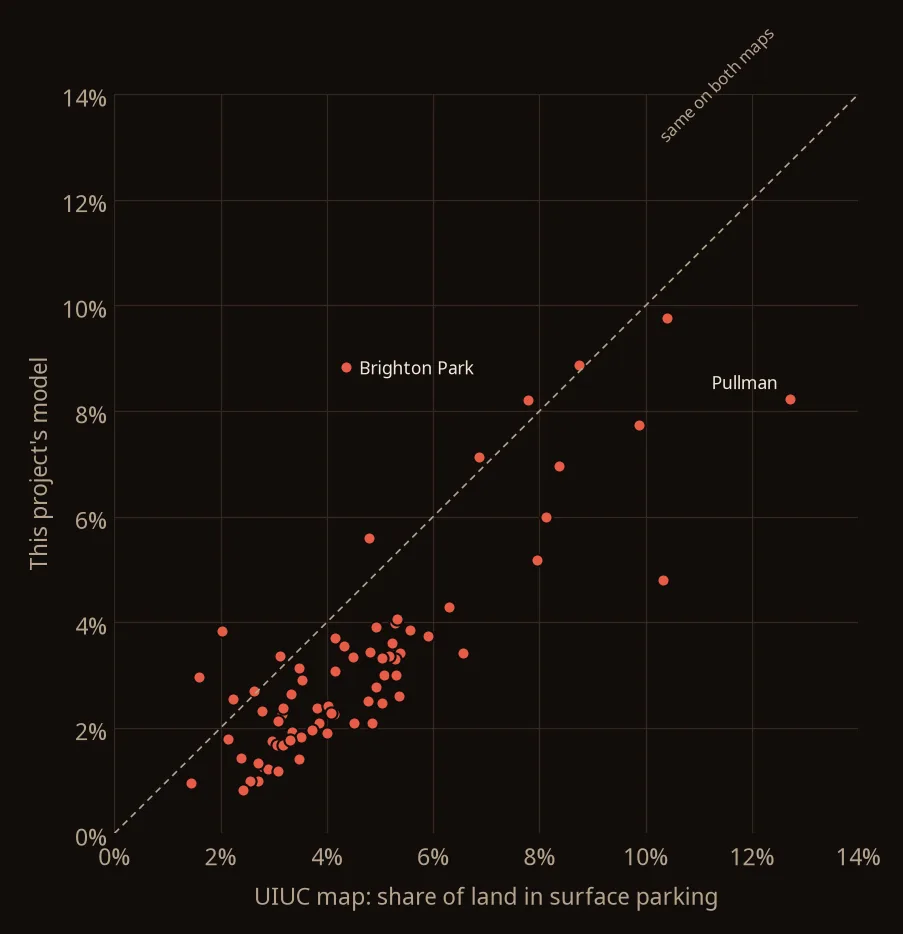
The two maps agree on where the parking is. Across Chicago's 77 community areas, their parking shares line up closely (a correlation of 0.81), and about 72% of the parking my model found sits within 3 meters of parking on theirs. They disagree on how much. UIUC's map has 27.4 km² of surface parking in the city, and mine has 19.7.
To find out which map was right where they disagreed, I pulled 12 random spots where only UIUC saw parking and 12 where only my model did, and checked each against the 2023 photo.
- Not one of the 24 was a false alarm. Every disagreement was either a real lot the other map missed, a mix, or a site that had changed between the two image dates.
- Where only UIUC saw parking, 10 of 12 were real lots my model missed.
- Where only my model saw parking, 8 of 12 were real lots UIUC missed.
Adding it up, Chicago has roughly 30.6 km² of surface parking (somewhere between about 27 and 33), or 5.1% of the city's land. My model found about two-thirds of that. UIUC's found about nine-tenths. Even 30.6 km² is a floor, since it only counts lots that at least one of the two models caught.
So when I say "at least" in this post, I mean it. The good news for the rest of the analysis is that the two maps agree on where parking is concentrated. Comparisons between places, like near transit vs. not, hold up better than the raw totals do.
Where the parking is
The heaviest concentrations are the places you'd guess: malls, office parks, big-box strips, industrial areas and the land around stadiums.
Among towns of at least 5 km², the most paved over are Bedford Park (7.8%), Crestwood (7.6%), Niles (7.2%), Matteson (7.1%), Vernon Hills (6.6%) and Schaumburg (6.3%). In total acreage, Chicago is far ahead, followed by Joliet, Naperville, Aurora and Schaumburg.
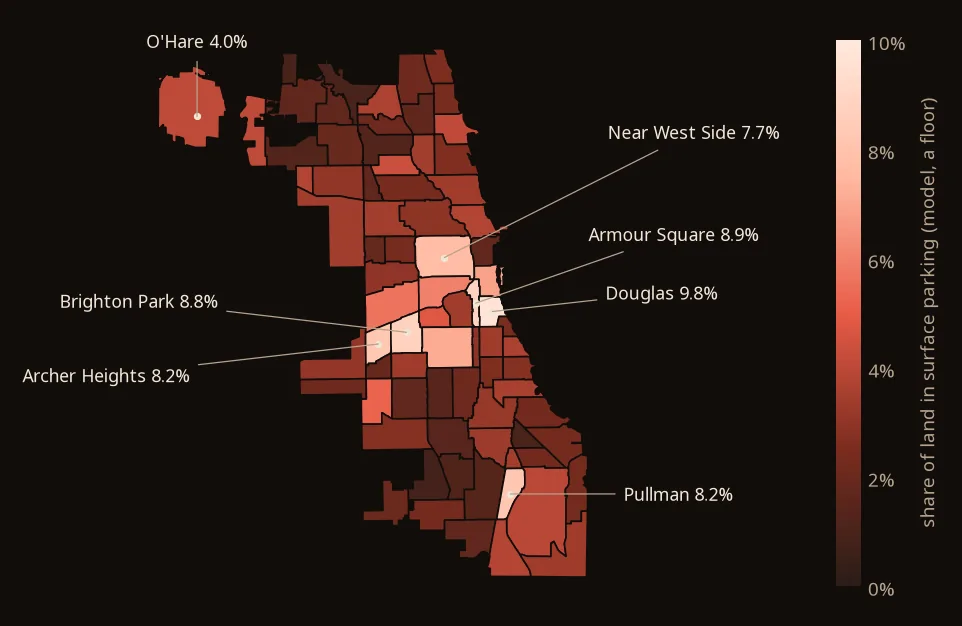
Inside Chicago, the community areas with the highest parking share are Douglas (9.8%, which includes the Illinois Institute of Technology campus and its lots), Armour Square (8.9%, home of the White Sox's Rate Field), Brighton Park (8.8%), Pullman (8.2%) and Archer Heights (8.2%).
O'Hare has the most parking of any community area by total area, about 1.4 km². But the airport is so big, and so much of it is runway, that its share (4.0%) doesn't make the top ten.
OpenStreetMap has half of it, at most
This was the finding I didn't expect.
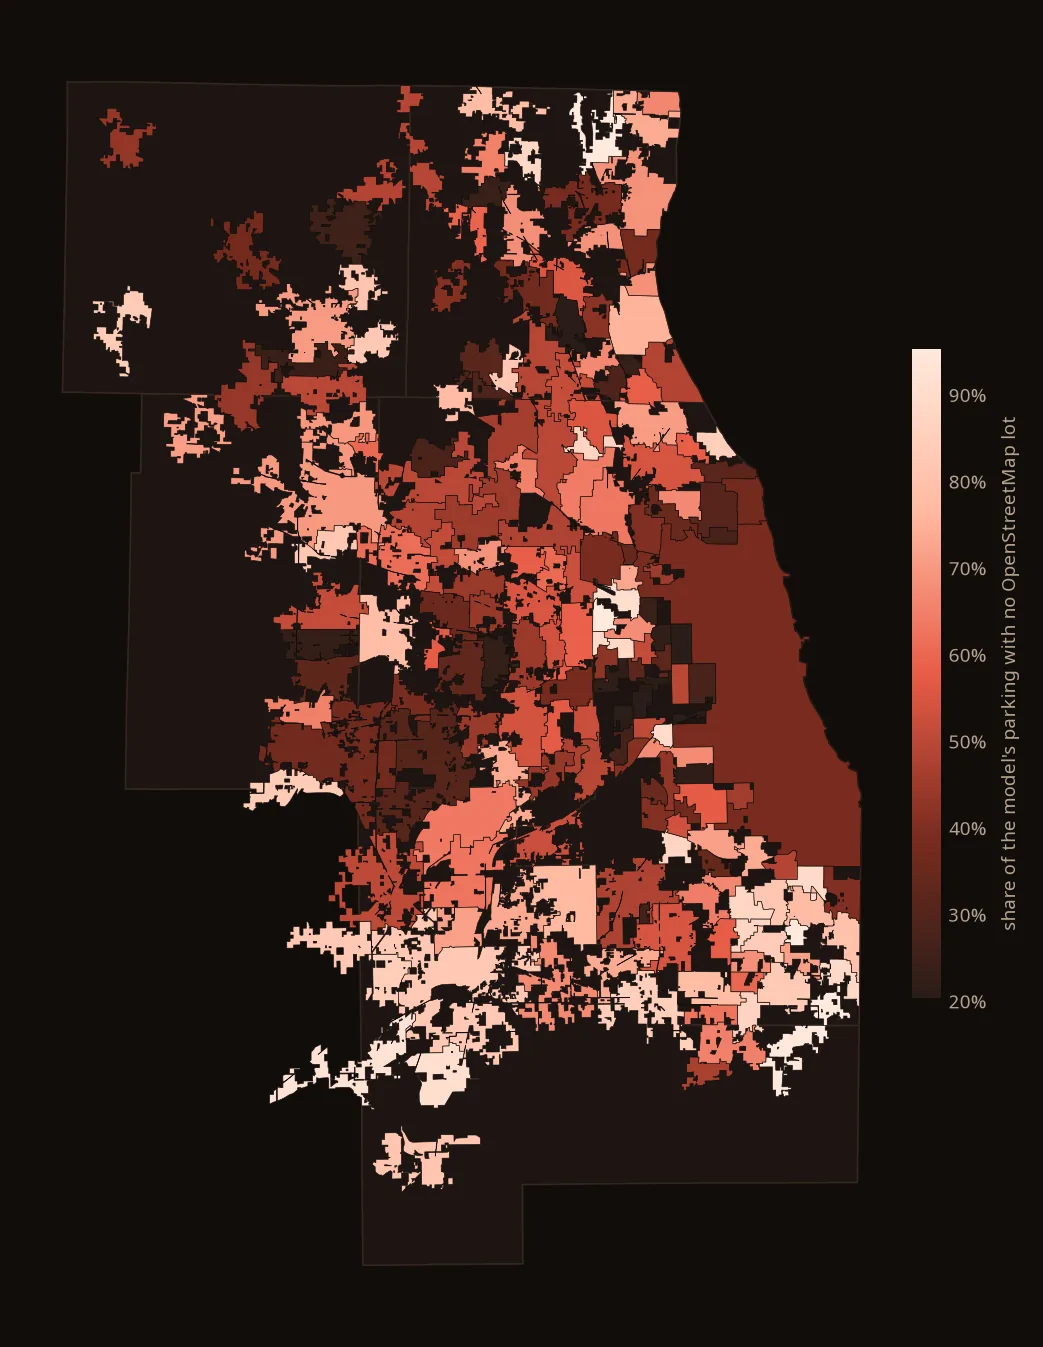
OSM is the free, volunteer-built map behind thousands of apps, including a lot of humanitarian work I do. Of the parking the model found, only about 47% lines up with a lot that's already in OSM. The other 79 km², roughly 19,500 acres, has no OSM parking lot under it at all. And since the model itself misses some lots, OSM's share of the real total is lower still.
That raised an obvious question: is the model just wrong? So I pulled 24 random spots from the model-only area, weighted by size, and graded each against the photo.
- 20 of 24 were real car parking lots that nobody had mapped.
- 1 was a truck yard, 1 a mix of cars and trucks, and 2 were roads the model mistook for lots.
With only 24 samples there's real uncertainty, but the conclusion holds: somewhere between about 50 and 75 km² of real, unmapped car parking is sitting in the region's imagery.
OSM coverage is worst in Will County, where it has only about 26% of the parking the model found. Joliet alone has about 3.9 km² of parking OSM doesn't show.
One caveat about freight. The places with the very lowest OSM coverage cluster around intermodal rail yards, where containers and trailers are parked in rows that look a lot like a parking lot from above: Elwood (9%), Northlake (5%), parts of Joliet and Brighton Park near the Corwith yard. I checked eight of those hotspots, and half were truck and container yards. So in those few places, part of the "unmapped parking" is really freight. Across the region as a whole, though, the random sample says it's mostly ordinary lots.
Chicago's 2025 rule
Chicago's ordinance (O2025-0015577) removed parking minimums in what it calls transit-served locations:
- within 2,640 feet (half a mile) of a CTA or Metra rail station, or
- within 1,320 feet (a quarter mile) of the CTA bus corridors listed in Table 17-17-0400-B of the zoning code,
except in the Downtown districts, which kept their own rules.
To map that area, I matched the table's 225 bus segments, each written as a street between two cross streets, to the actual streets in OSM, and combined them with the rail station buffers.
The result is bigger than most people would guess. The rule covers about 420 km², or 70% of Chicago's land. And it holds 71% of the city's surface parking: about 14.1 km², or 3,470 acres.
Land near transit isn't much less parking-heavy than the rest of the city: 3.35% of the transit-served area is surface parking, compared with 3.13% everywhere else. A lot of that is commercial strips along the same bus corridors that put the land inside the rule.
The state law reaches the suburbs
The People Over Parking Act works differently. Instead of a fixed list of streets, it uses a frequency test. Parking minimums are banned within:
- half a mile of any rail station (CTA, Metra, South Shore or Amtrak), and of any spot where two frequent bus routes cross, and
- an eighth of a mile of any street where buses come every 15 minutes or better during the morning and evening rush.
The Northern Illinois Transit Authority (NITA) published the official map of where that applies. It covers 938 km², about 10% of the region's land, but 24% of its surface parking: about 35.8 km², or 8,850 acres.
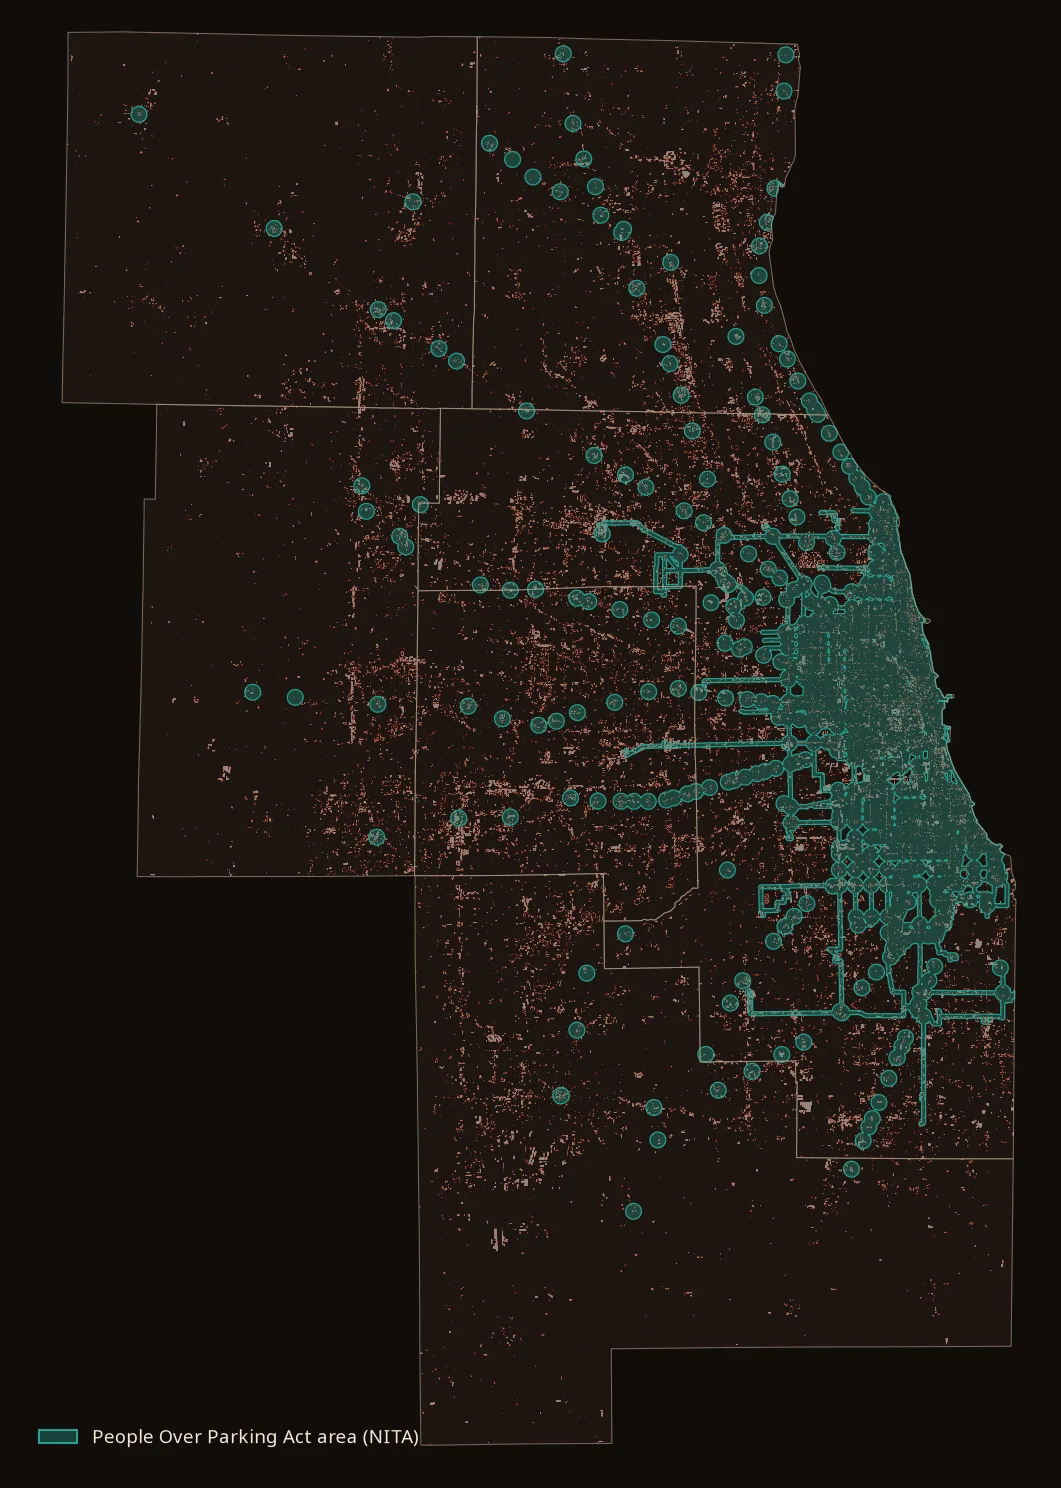
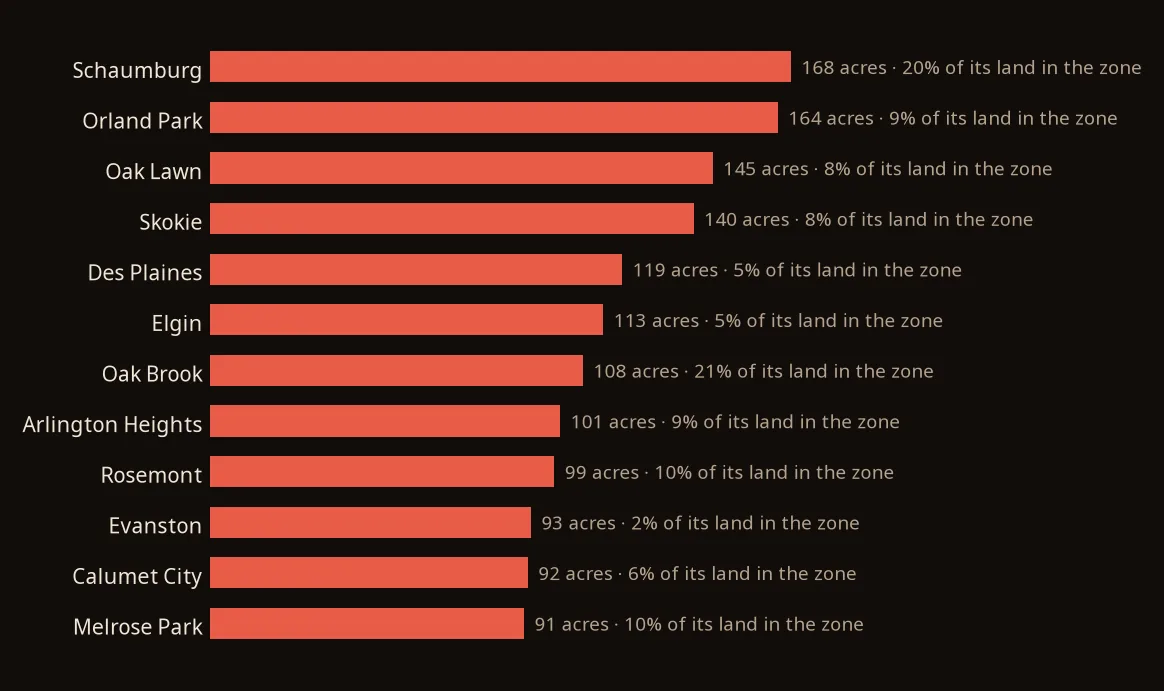
In the suburbs, the law covers 468 km² that holds about 20 km² (4,940 acres) of surface parking. Inside that zone, 4.5% of the land in incorporated towns is surface parking. In the same towns, outside the zone, it's 2.6%. The pattern repeats in every county: land near transit has more parking, not less. That makes sense. Train stations come with commuter lots, and frequent bus routes run along the busiest commercial streets.
The suburbs with the most parking inside the zone are Schaumburg (about 170 acres), Orland Park (160), Oak Lawn (150), Skokie (140) and Des Plaines (120).
Schaumburg and Oak Brook stand out for another reason. Inside the zone, about a fifth of their land is parking lot. That's because Pace buses meet at Woodfield Mall and Oakbrook Center. Where several routes add up to a bus every 15 minutes, NITA counts the stop as a transportation hub and draws a half-mile circle around it. Those two circles are mostly mall parking. If any surface lots in the suburbs are going to be redeveloped without having to replace every space, these are good candidates.
In Chicago, the two rules overlap
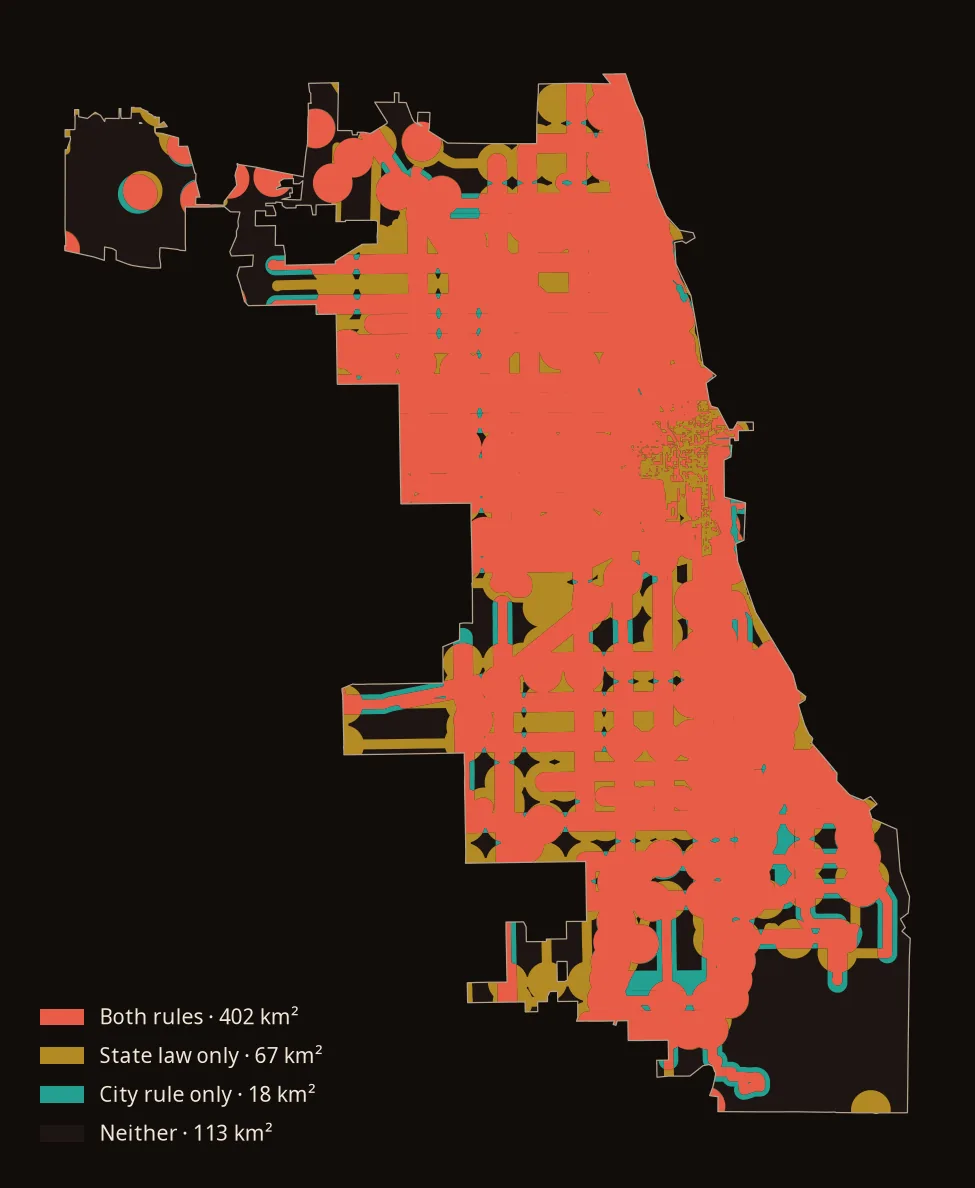
Inside the city, both laws now apply, and they don't cover quite the same ground.
- Both rules: 402 km²
- State law only: 67 km². This includes all of the Downtown districts the city left out (62 acres of surface parking there) and frequent bus routes that weren't in the city's 2022 table.
- City rule only: 18 km², mostly listed bus corridors where service doesn't meet the state's 15-minute test.
Together, one rule or the other now covers 81% of Chicago's land and 82% of its surface parking.
What this is, and what it isn't
- It's a baseline, not a before and after. The imagery is from 2023, before either law. Whether these laws actually shrink the region's parking will take years to show up, and a future NAIP flight could measure it with the same model.
- It only counts surface lots. Garages, underground parking and curb parking are invisible from the air or deliberately left out.
- The totals are a floor. On every check I did, the model missed more real parking than it made up. In Chicago it found about two-thirds of what's there.
- Comparisons between places assume the model misses lots at a similar rate everywhere. The close match with UIUC's map across Chicago's community areas suggests it mostly does, but I haven't checked that in the suburbs.
- Lots aren't wasted land by definition. Some are full every day. This measures how much land is parking, not whether it's needed.
Data and code
Everything is open: NAIP 2023 from Microsoft's Planetary Computer, OpenStreetMap, Census boundaries, CTA and Metra GTFS, NITA's POPA layer, and Chicago's zoning code. The notebooks that do every step, from downloading imagery to the final tables, are on GitHub.
If you map in OpenStreetMap, the model-only lots are a ready-made to-do list, and I'm happy to share them.
Every step is a notebook in the repo, from downloading the imagery and training the model to the zonal statistics, the transit-served areas and the two hand-graded checks.
View the code (opens in a new tab)